
A young COAST rider holding a COAST-branded keepsake.

Reports & Resources

COAST is committed to transparency and accountability. Explore our annual impact reports, customer surveys, financial information, and operational performance data to learn more about our services, financial stewardship, and the impact we make throughout the communities we serve.

COAST Reports

Annual Impact Reports

FY23 (PDF)

FY24 (PDF)

FY25 (PDF)

Financial Data

FY25 Year End Financial Information

FY25 Year End Budgeted and Actual Revenues
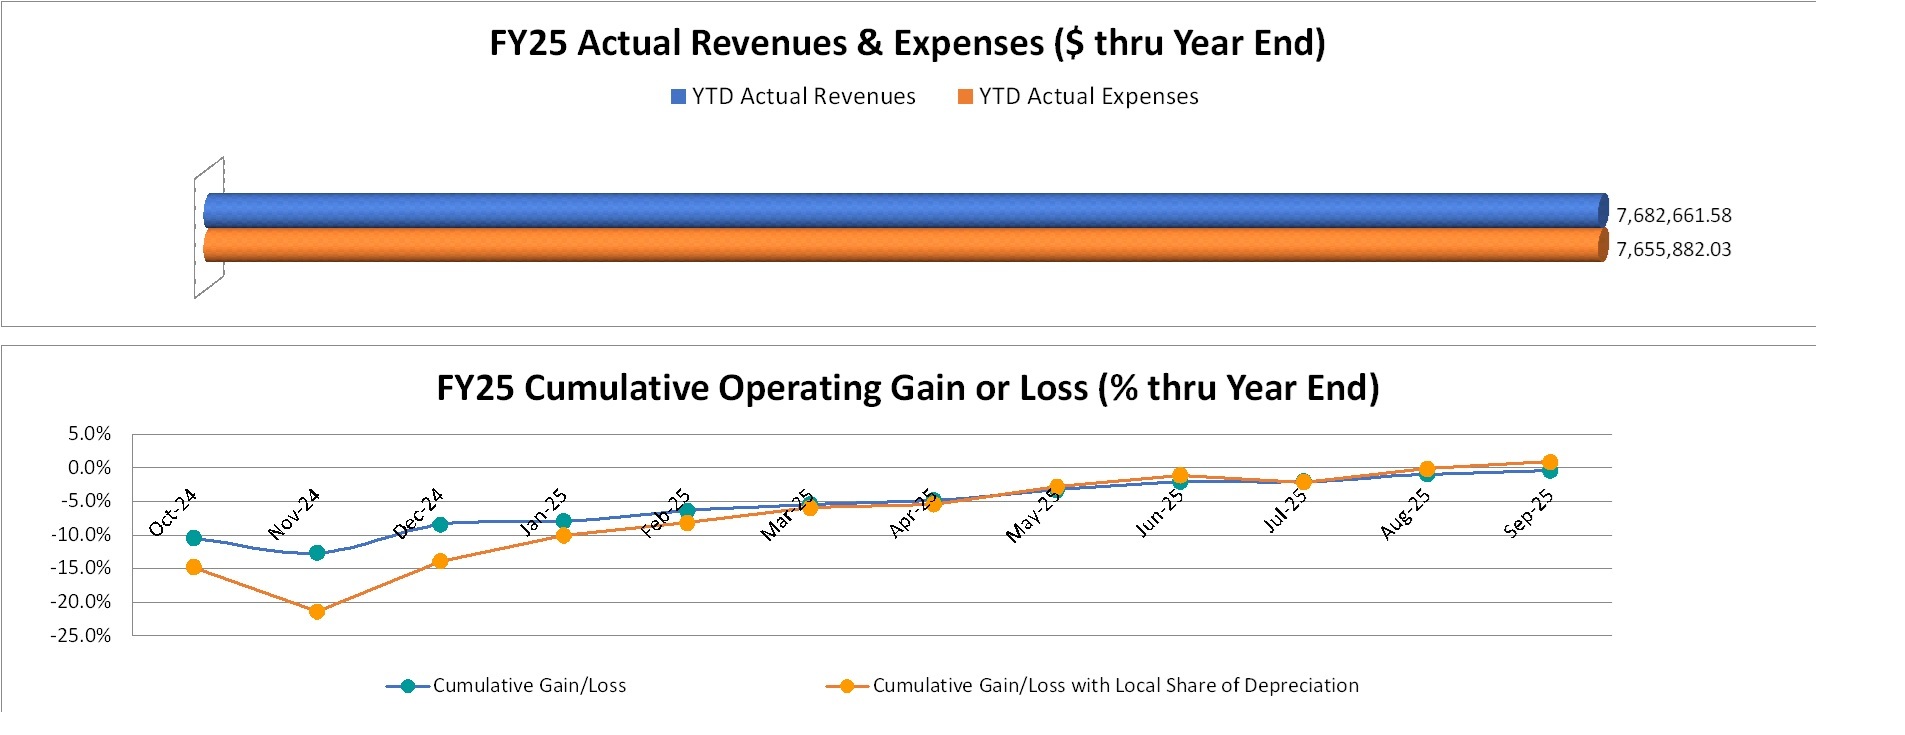
FY25 Year End Budgeted and Actual Revenues — chart 1

* As a non-profit organization, any gains are reinvested back into the organization and used for paying future expenses.

FY24 Year End Financial Information

FY24 Year End Budgeted and Actual Revenues
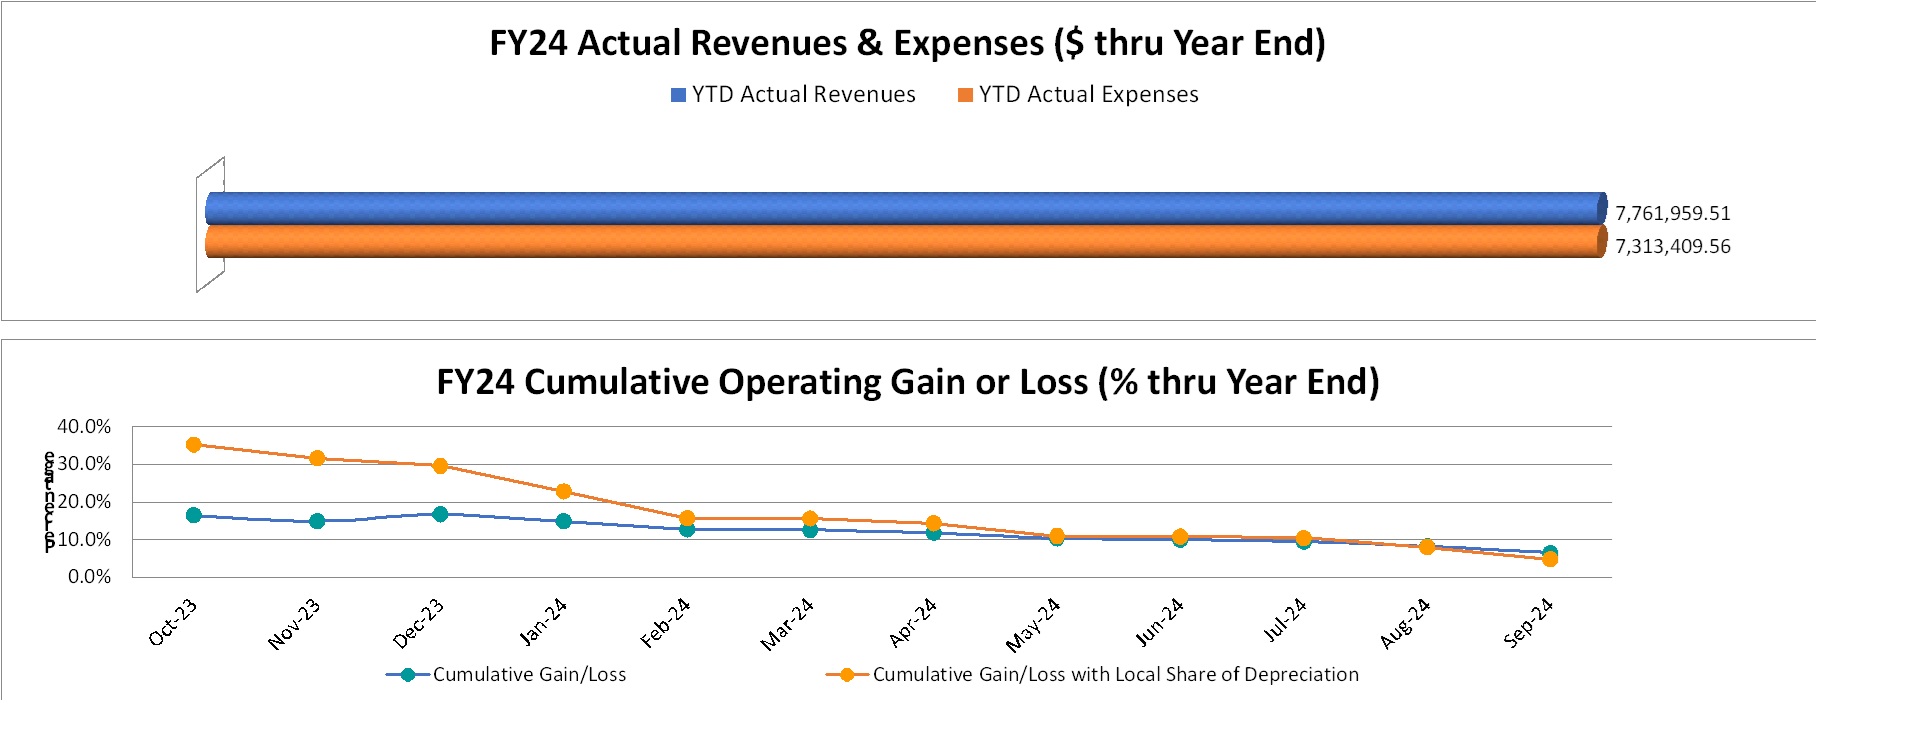
FY24 Year End Budgeted and Actual Revenues — chart 1
FY23 Year End Financial Information

FY23 Year End Budgeted and Actual Revenues

FY23 Year End Budgeted and Actual Revenues — chart 1

FY23 Year End Cumulative Operating Gain or Loss
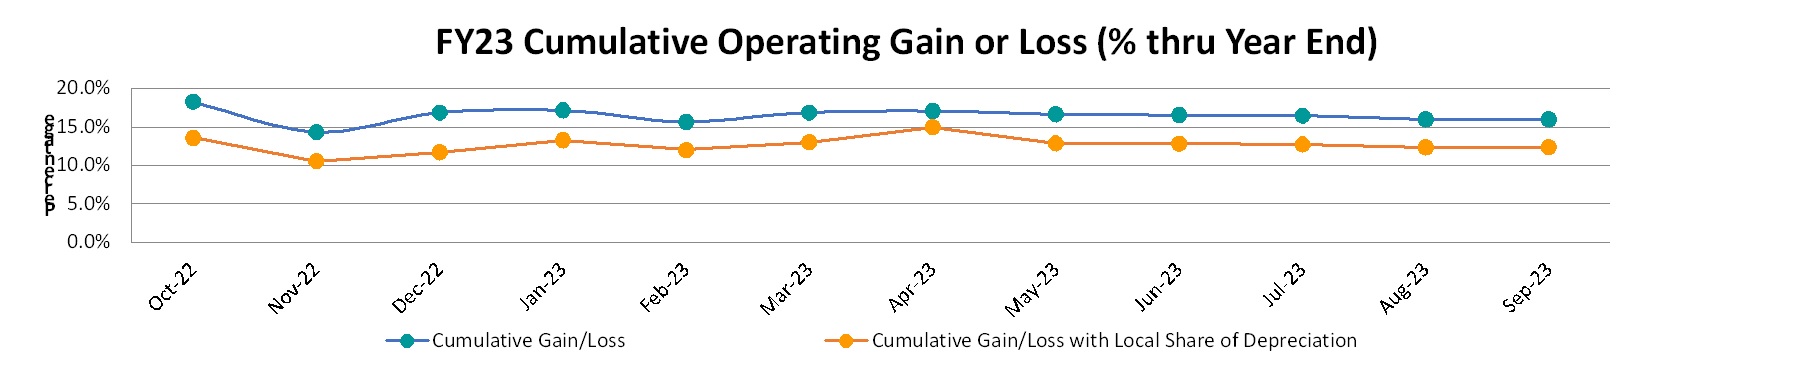
FY23 Year End Cumulative Operating Gain or Loss — chart 1

* As a non-profit organization, any gains are reinvested back into the organization and used for paying future expenses.

FY22 Year End Financial Information

FY22 Year End Budgeted and Actual Revenues

FY22 Year End Budgeted and Actual Revenues — chart 1

FY22 Year End Cumulative Operating Gain or Loss
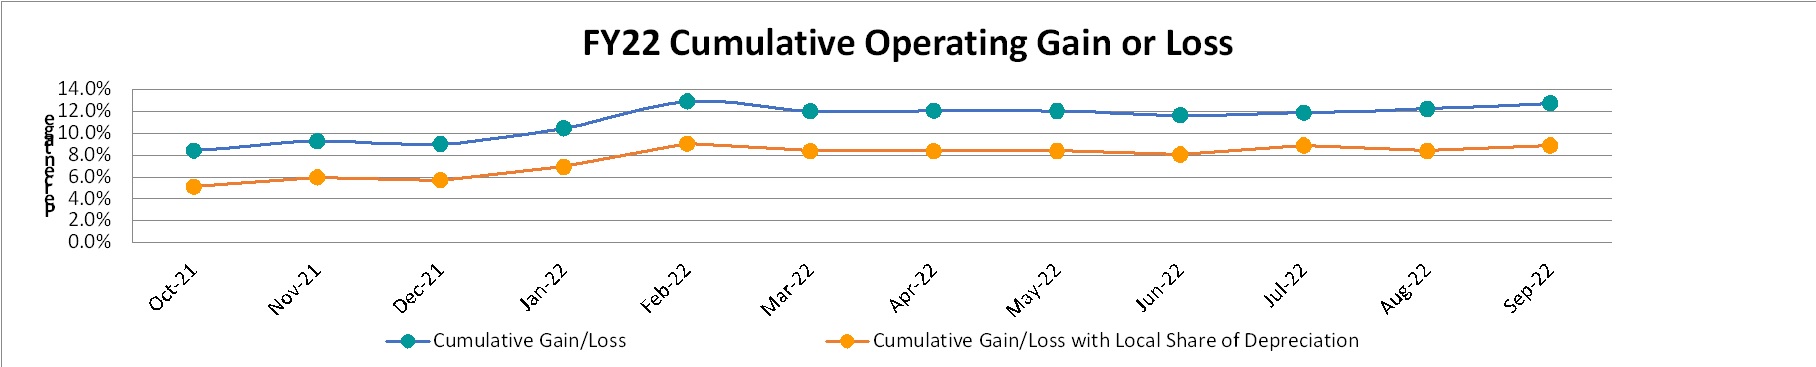
FY22 Year End Cumulative Operating Gain or Loss — chart 1
FY21 Year End Financial Information

FY21 Year End Budgeted and Actual Revenues

FY21 Year End Budgeted and Actual Revenues — chart 1

FY21 Year End Cumulative Operating Gain or Loss
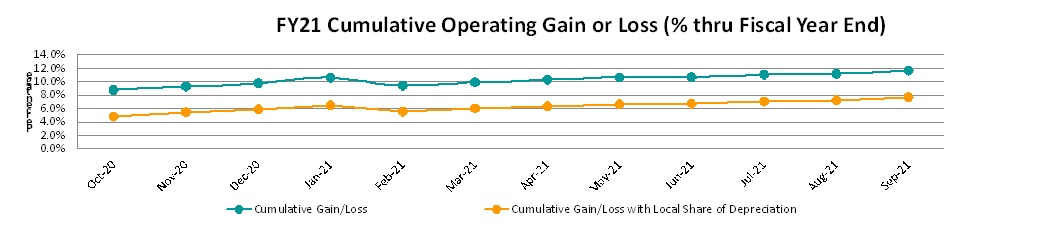
FY21 Year End Cumulative Operating Gain or Loss — chart 1
FY20 Year End Financial Information

FY20 Year End Budgeted and Actual Revenues

FY20 Year End Budgeted and Actual Revenues — chart 1

FY20 Cumulative Operating Gain or Loss
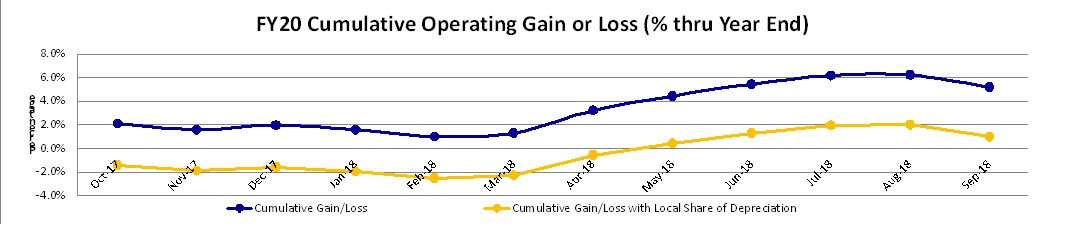
FY20 Cumulative Operating Gain or Loss — chart 1
FY19 Year End Financial Information

FY19 Year to Date Budgeted and Actual Revenues
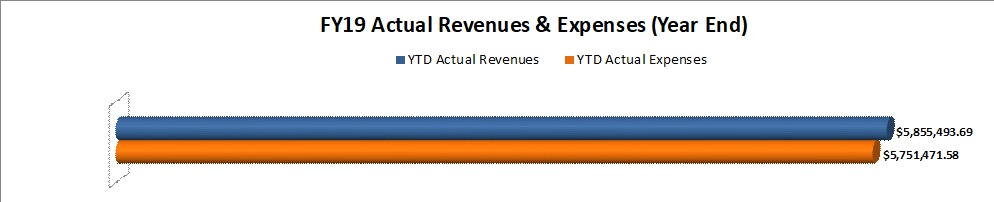
FY19 Year to Date Budgeted and Actual Revenues — chart 1

FY19 Year to Date Cumulative Operating Gain or Loss
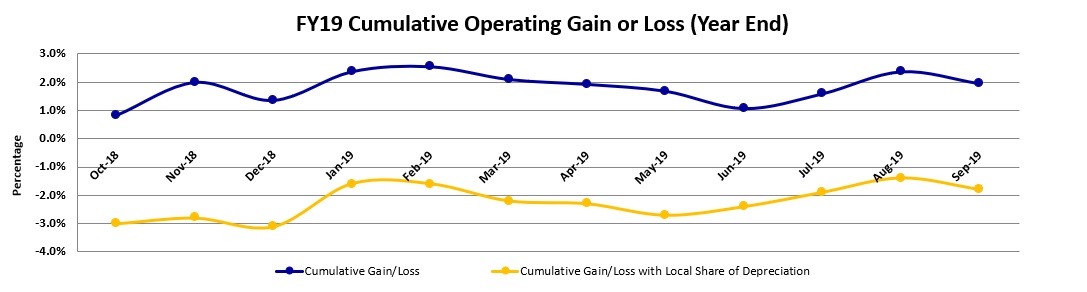
FY19 Year to Date Cumulative Operating Gain or Loss — chart 1

* As a non-profit organization, any gains are reinvested back into the organization and used for paying future expenses.

Operational Data

FY26 Year End Operations Information
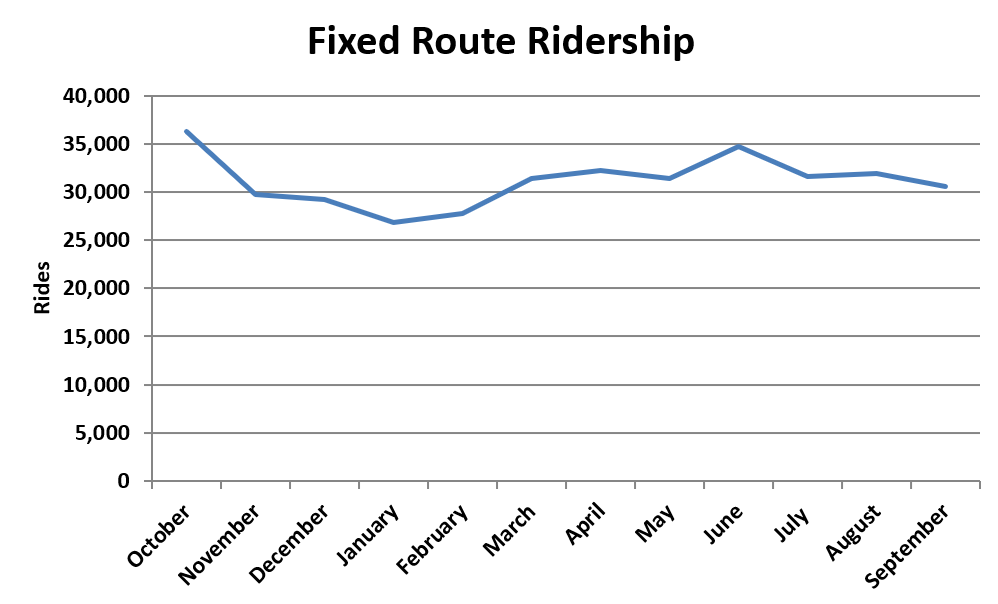
FY26 Year End Operations Information — chart 1
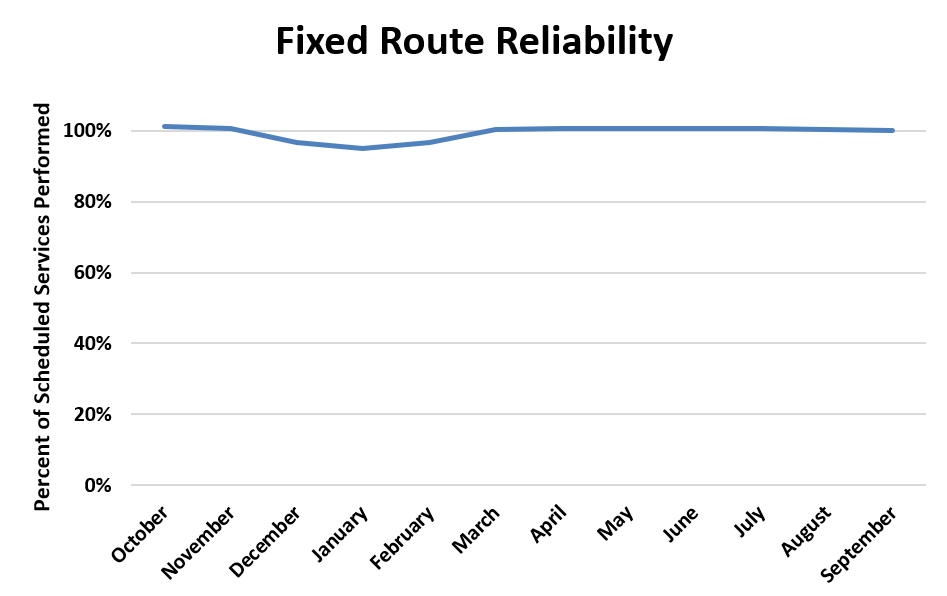
FY26 Year End Operations Information — chart 2
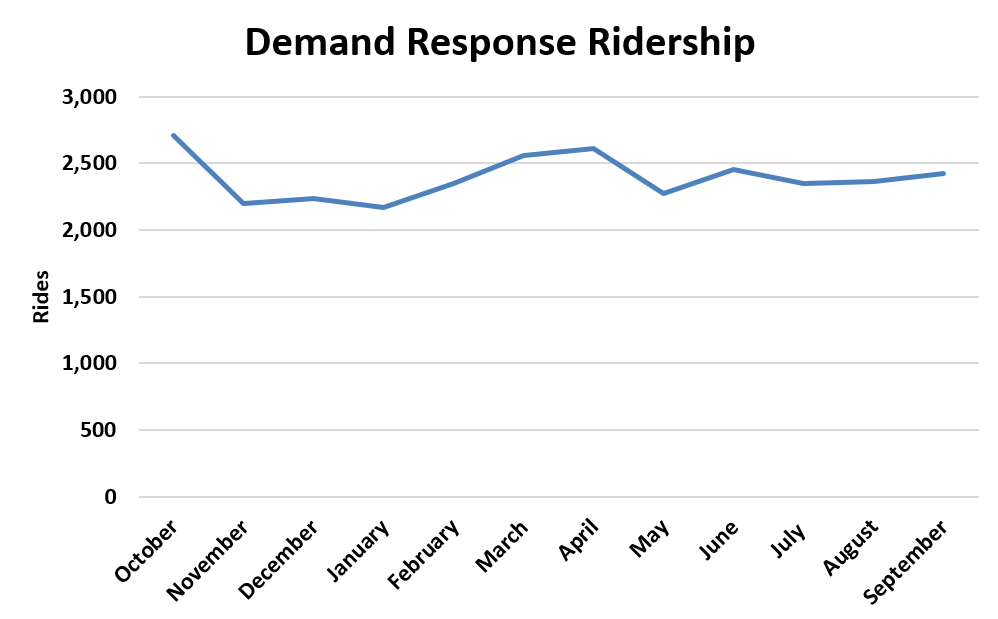
FY26 Year End Operations Information — chart 3
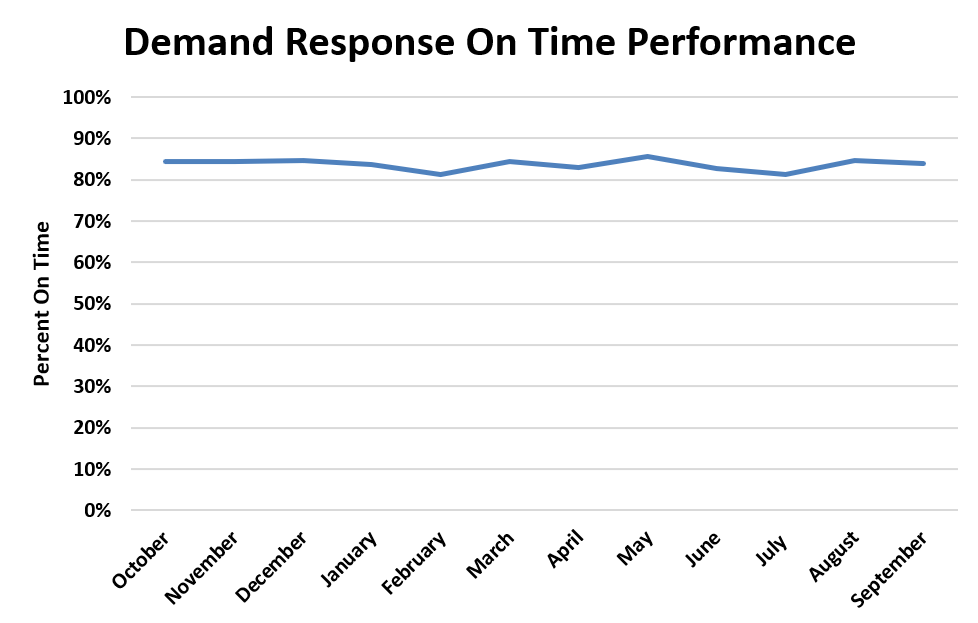
FY26 Year End Operations Information — chart 4
FY26 Year End Operations Information — chart 5
FY25 Year End Operations Information
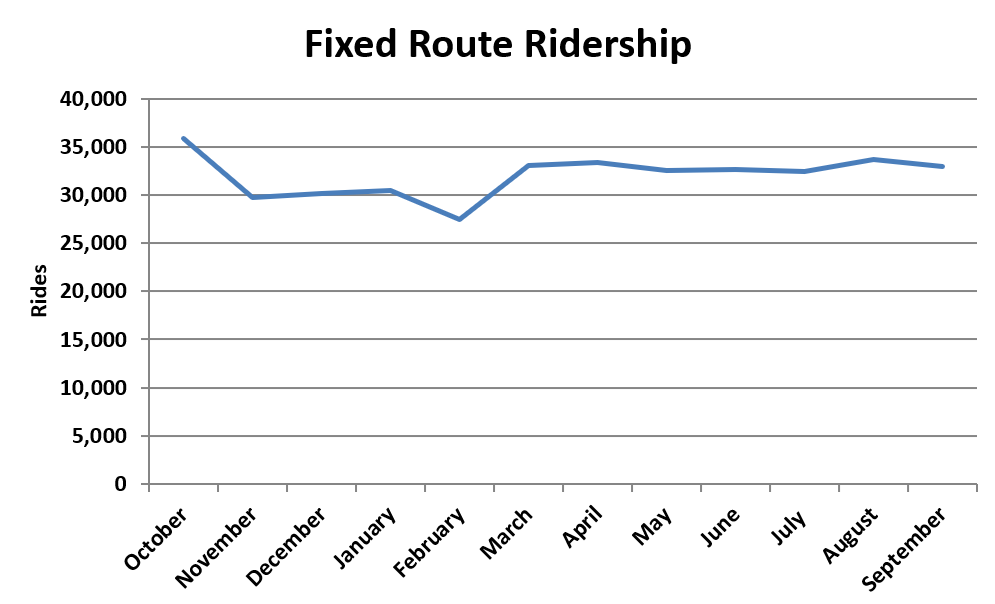
A chart showing fixed route ridership trends for fiscal year 2025.
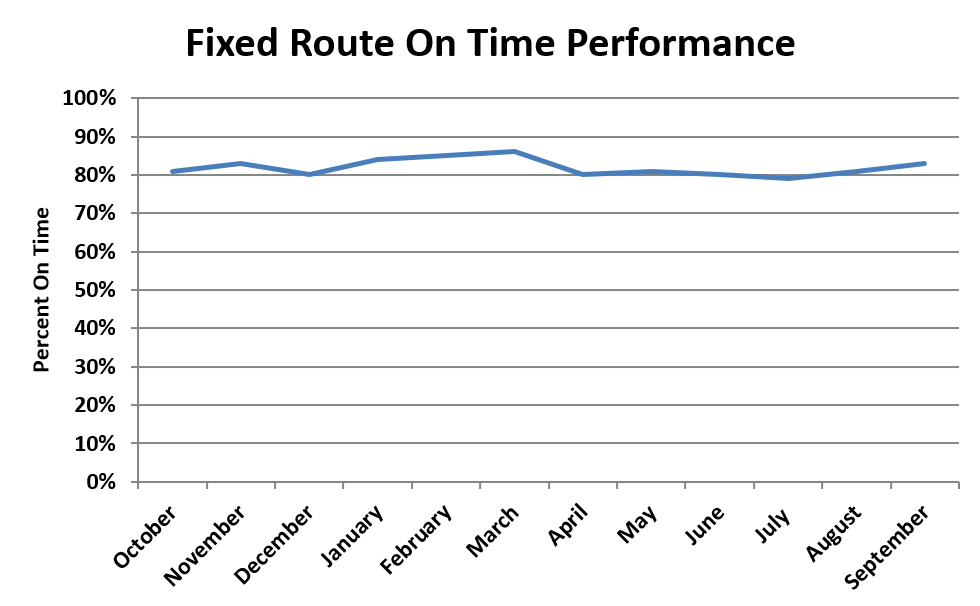
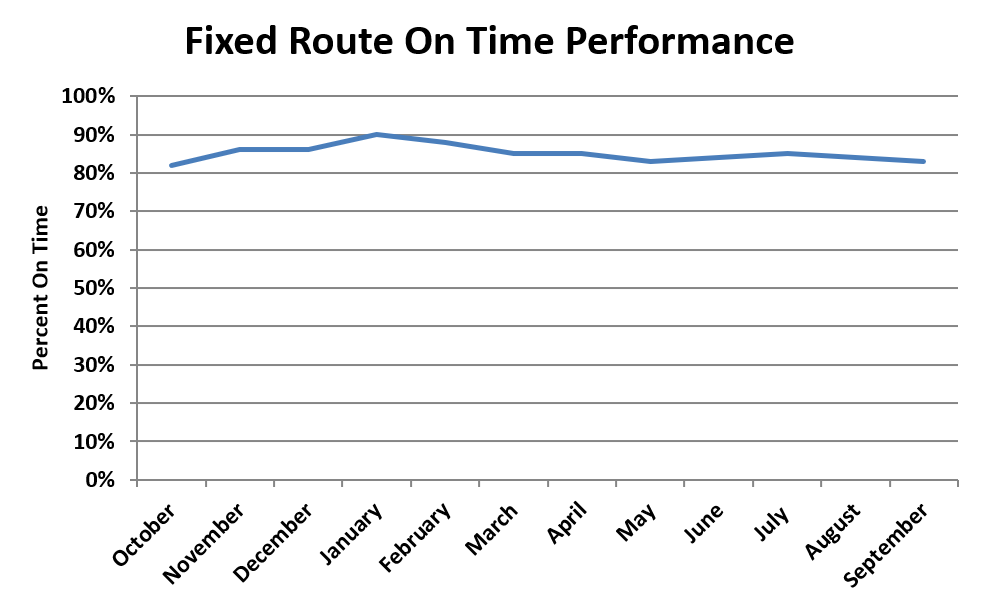
A chart showing fixed route on time performance trends for fiscal year 2025.
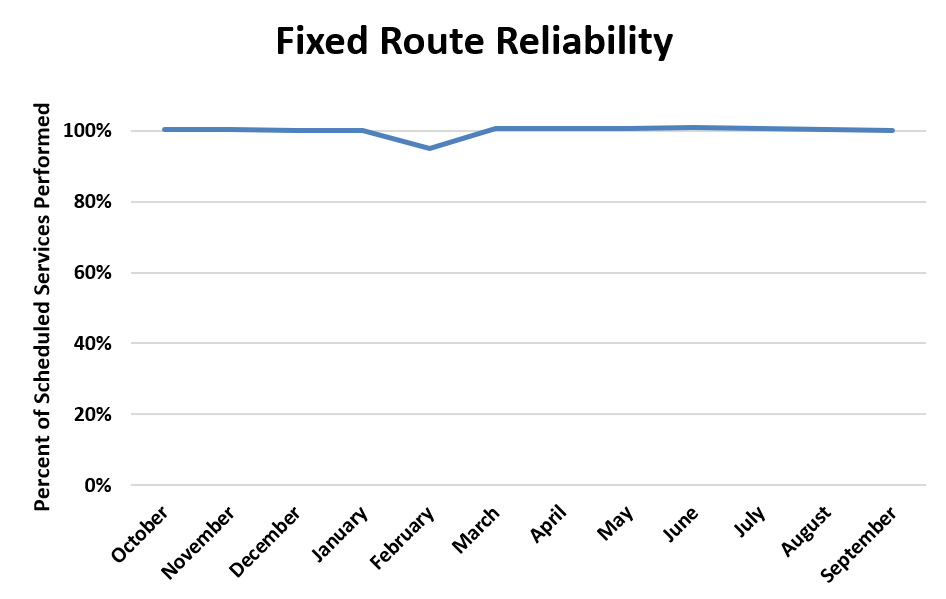
A chart showing fixed route reliability trends for fiscal year 2025.
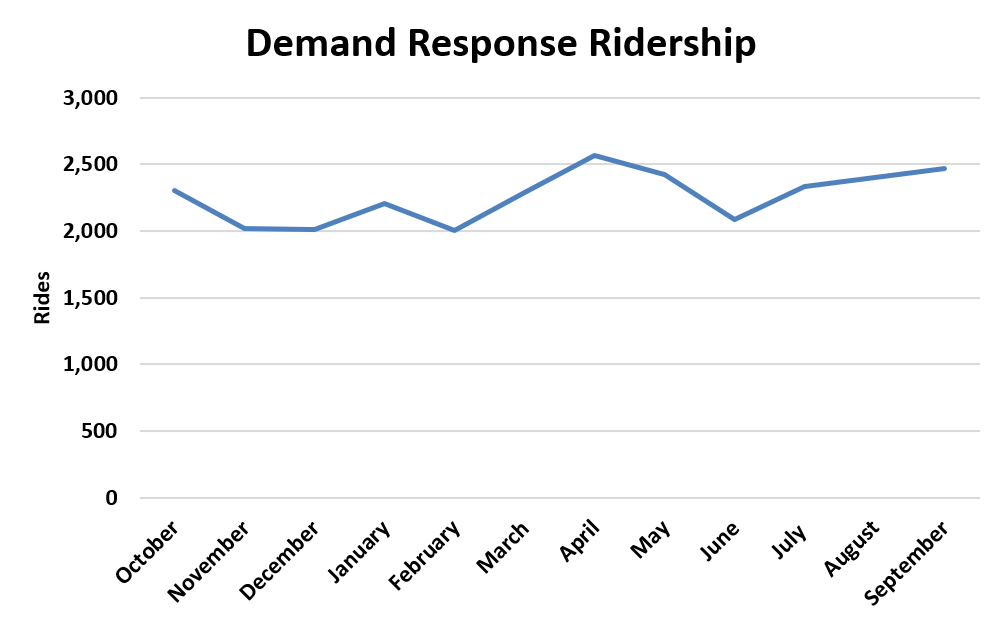
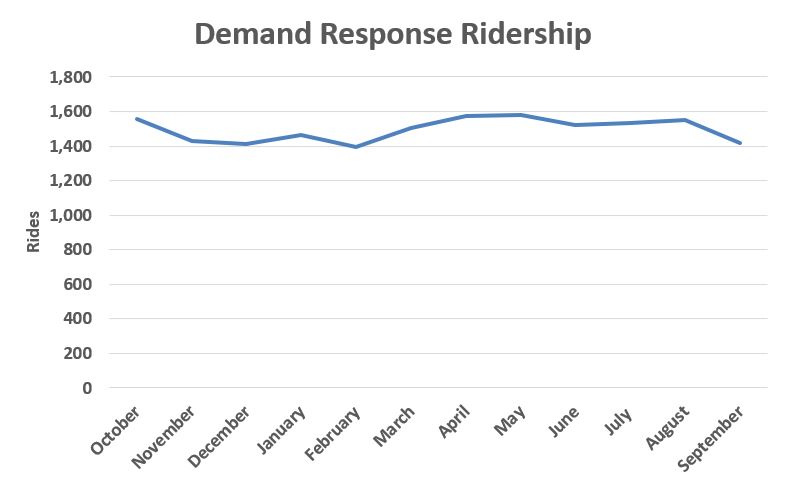
A chart showing demand response ridership trends for fiscal year 2025.
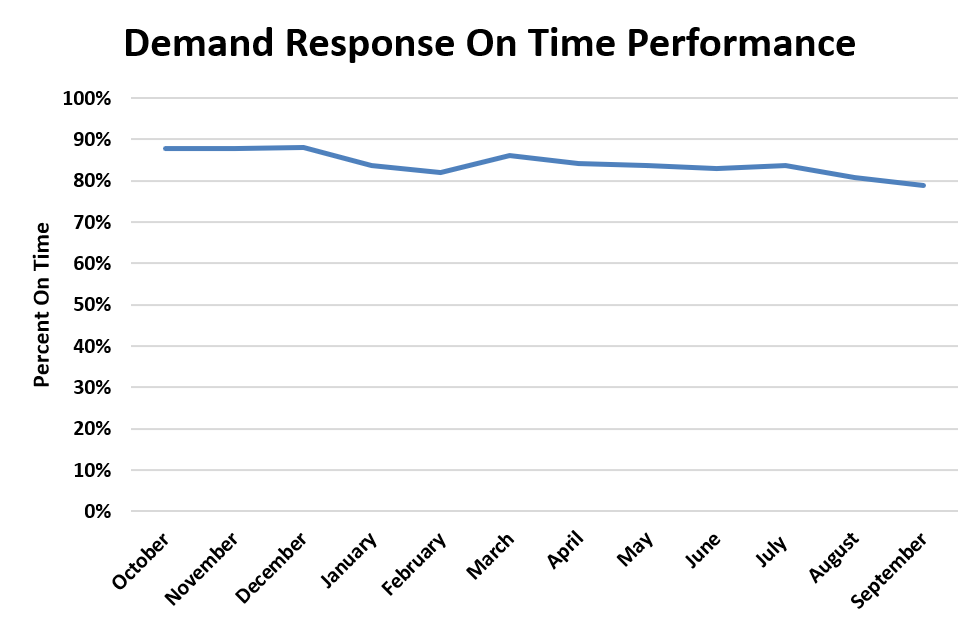
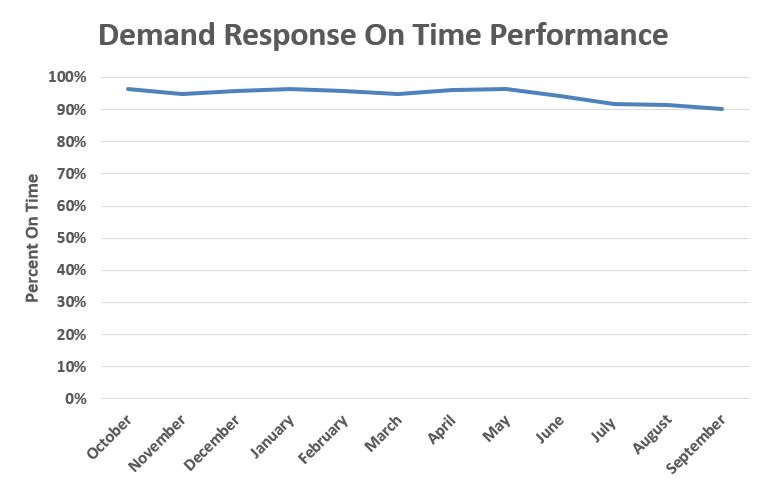
A chart showing demand response on time performance trends for fiscal year 2025.
FY24 Year End Operations Information
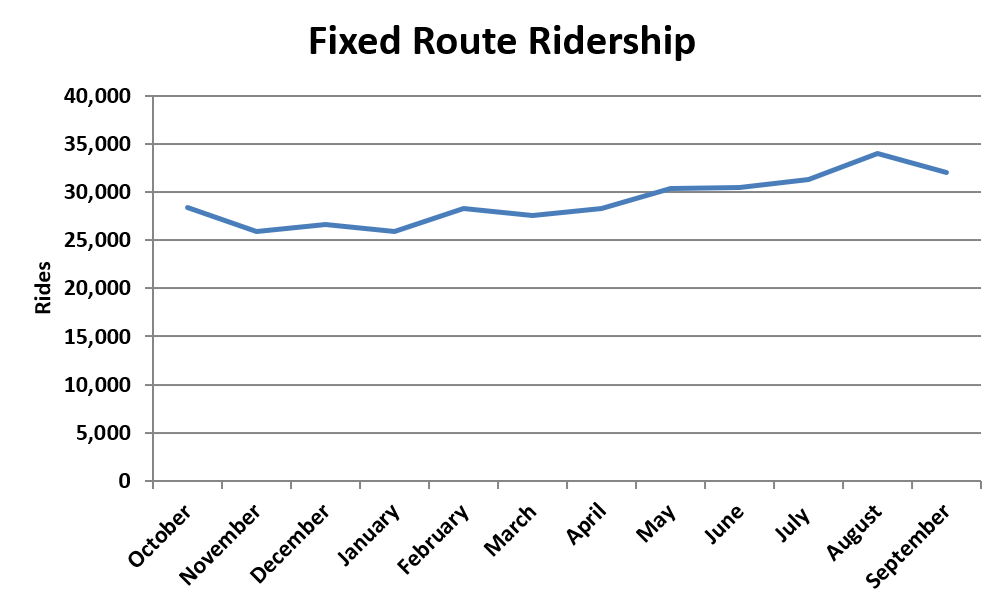
FY24 Year End Operations Information — chart 1
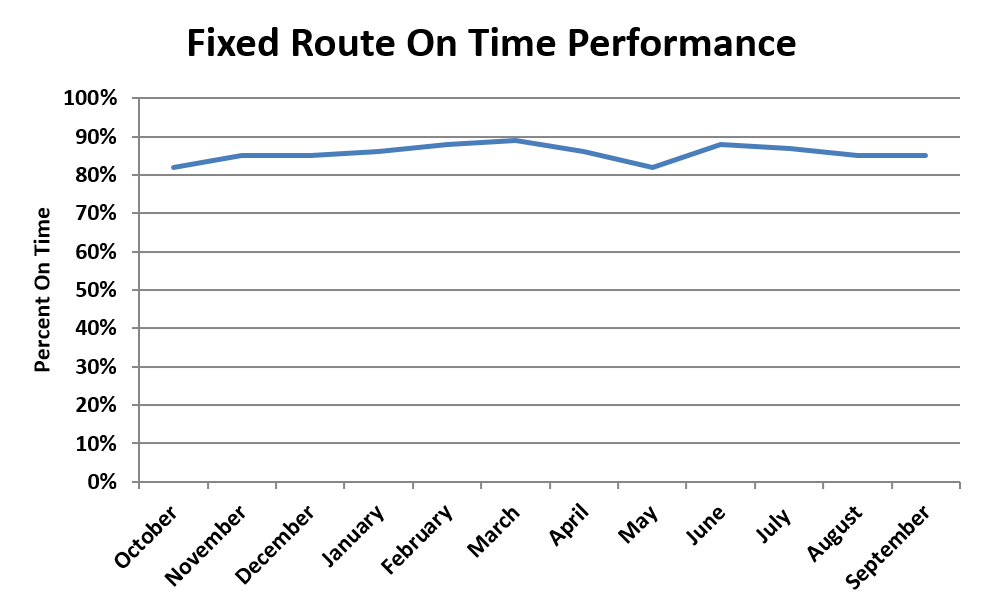
FY24 Year End Operations Information — chart 2
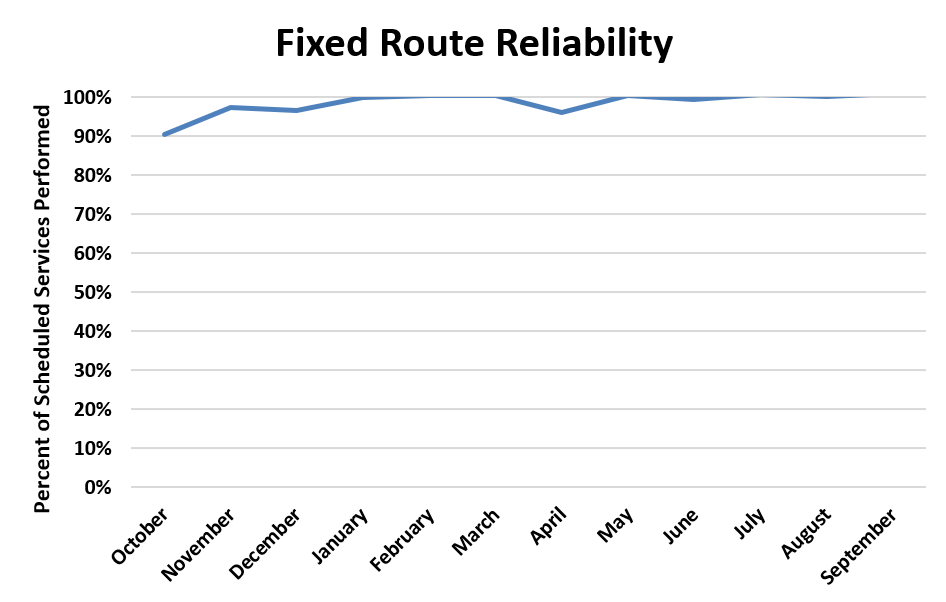
FY24 Year End Operations Information — chart 3
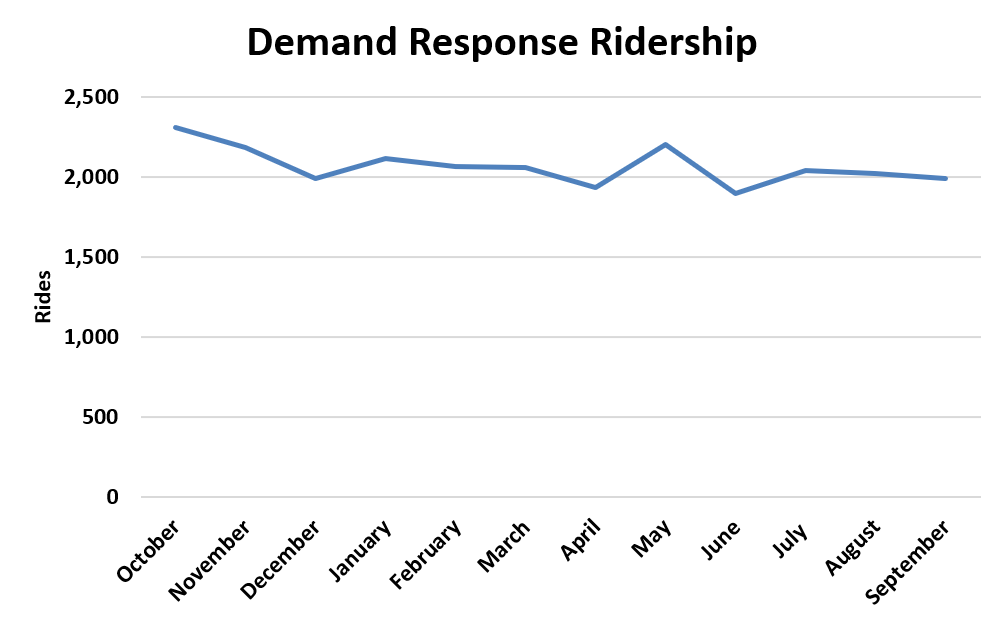
FY24 Year End Operations Information — chart 4
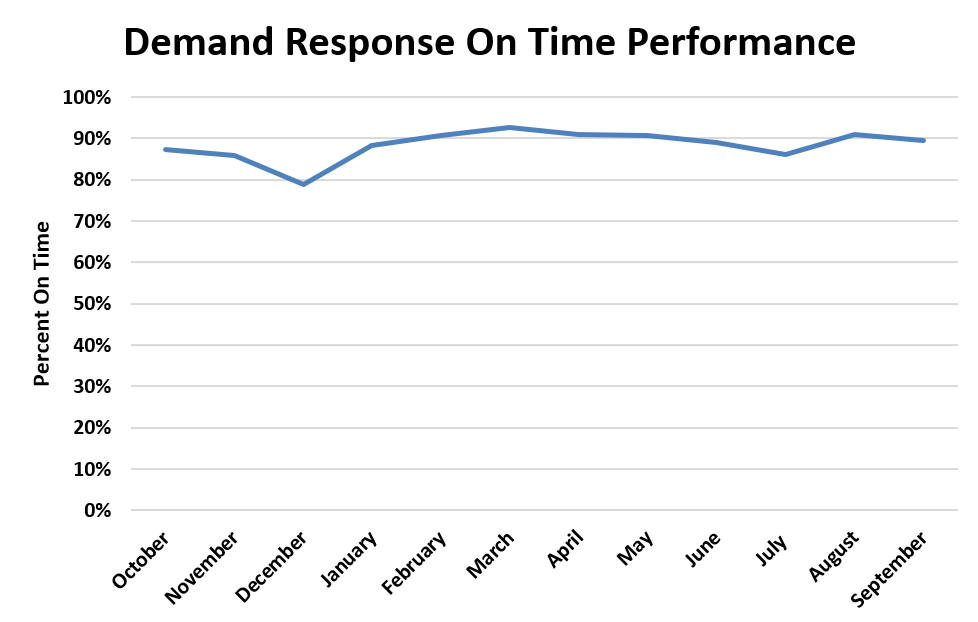
FY24 Year End Operations Information — chart 5
FY23 Year End Operations Information
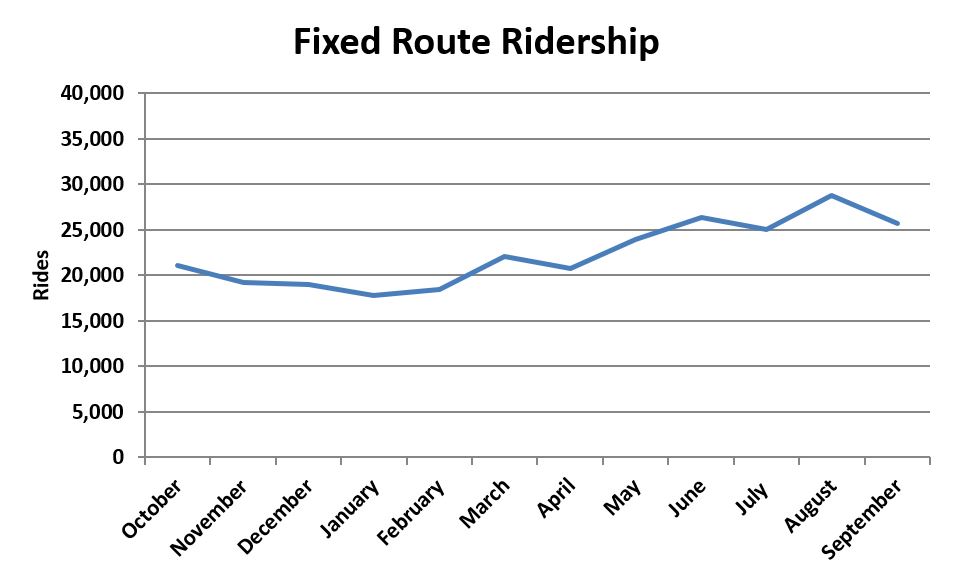
FY23 Year End Operations Information — chart 1
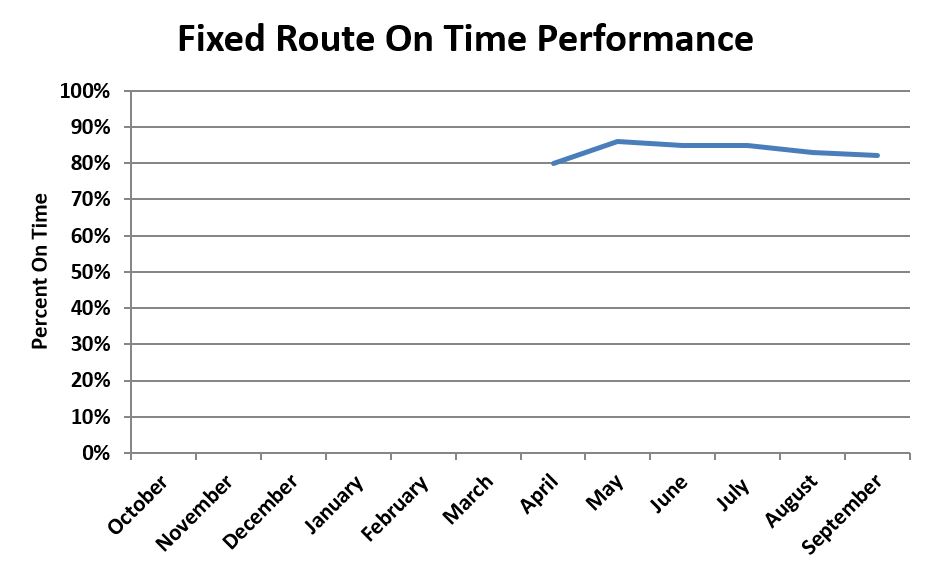
FY23 Year End Operations Information — chart 2
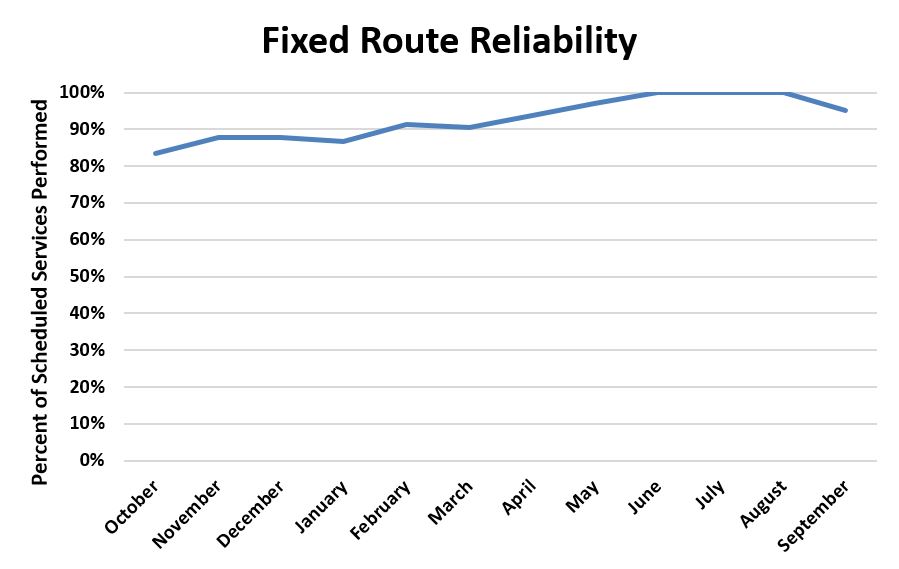
FY23 Year End Operations Information — chart 3
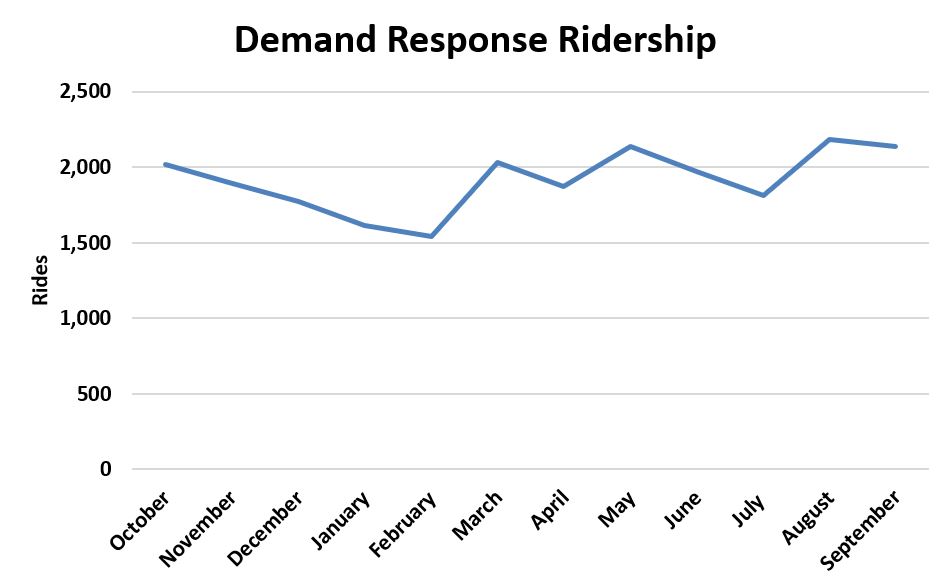
FY23 Year End Operations Information — chart 4
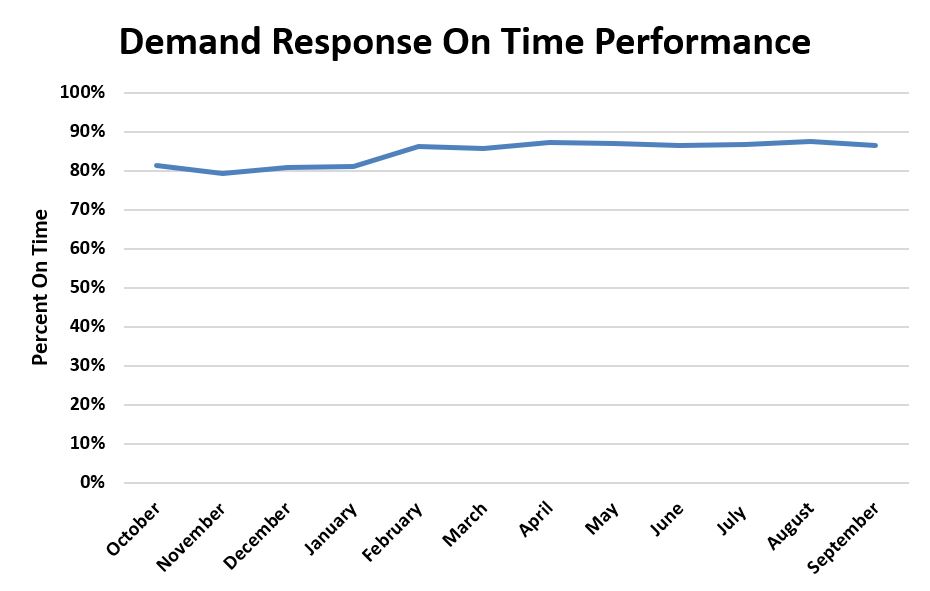
FY23 Year End Operations Information — chart 5
FY22 Year End Operations Information
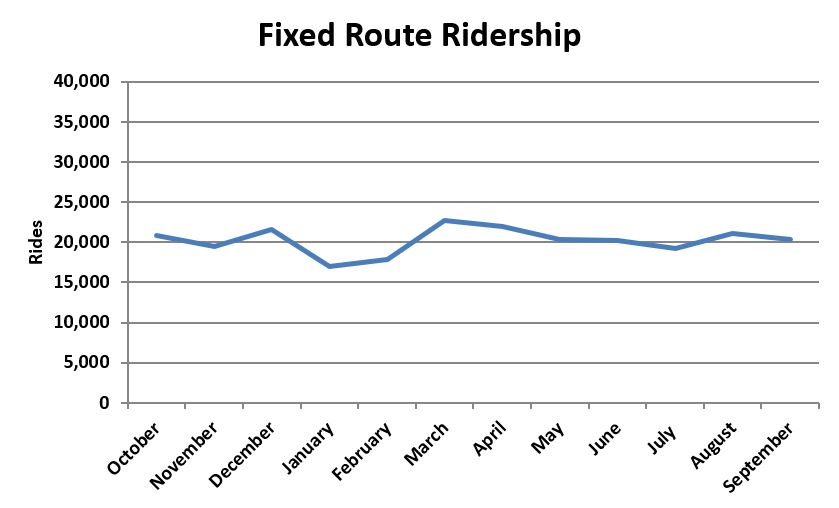
FY22 Year End Operations Information — chart 1
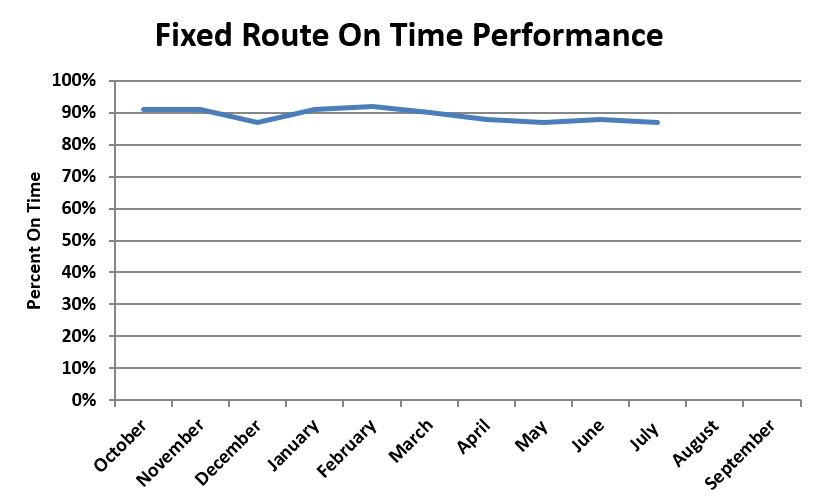
FY22 Year End Operations Information — chart 2

Fixed Route On Time Performance is not available for August and September, due to the transition from DoubleMap to Passio real-time tracking.
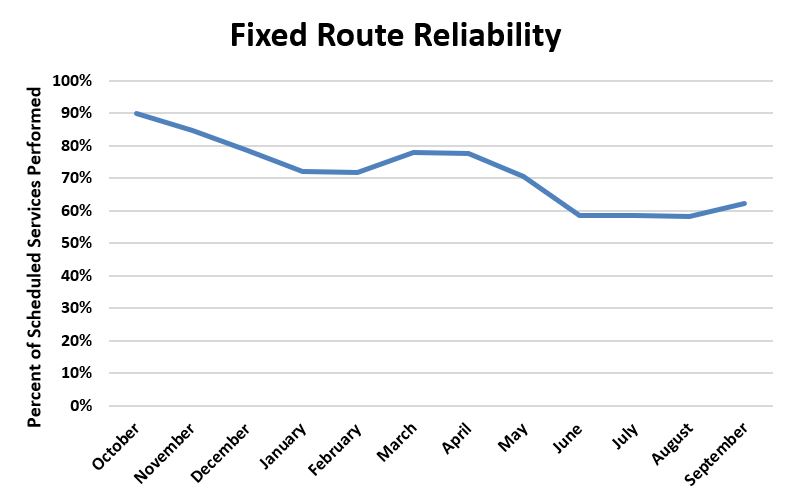
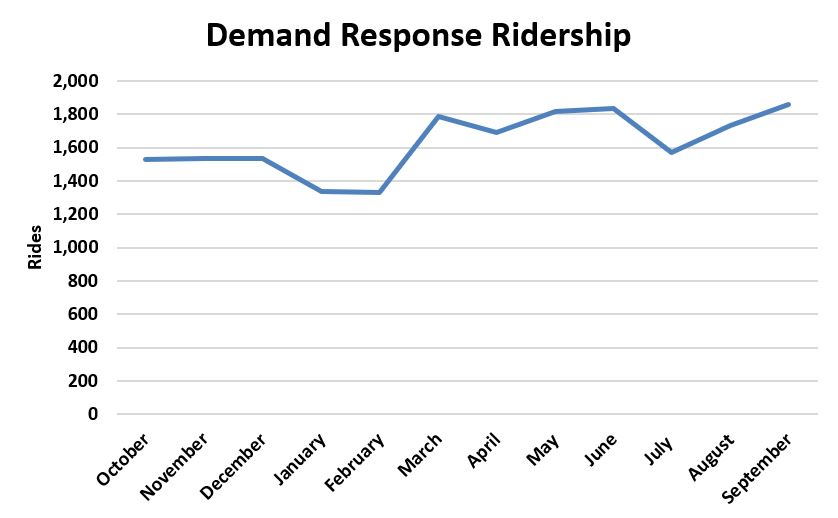
FY22 Year End Operations Information — chart 1
FY22 Year End Operations Information — chart 2
FY22 Year End Operations Information — chart 3
FY21 Year End Operations Information
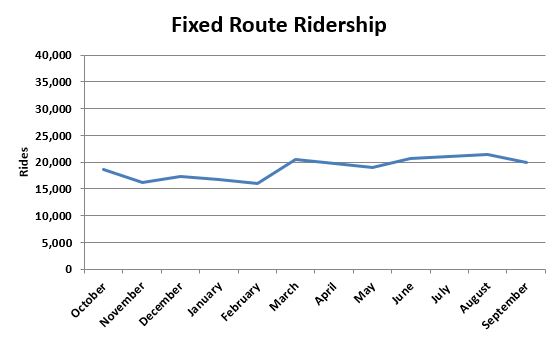
FY21 Year End Operations Information — chart 1
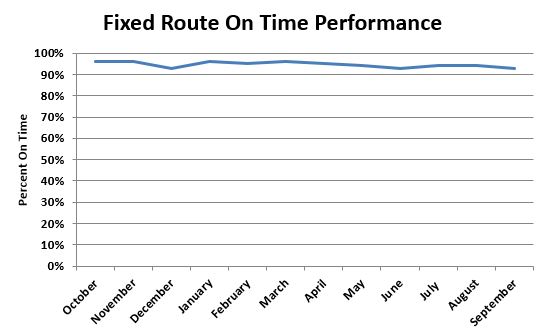
FY21 Year End Operations Information — chart 2
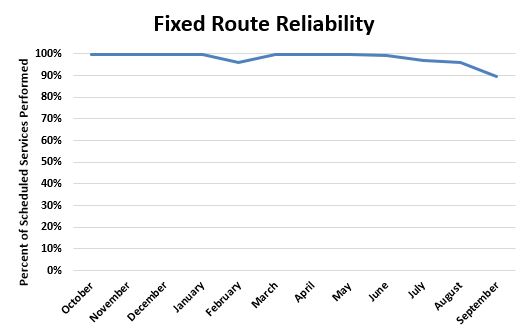
FY21 Year End Operations Information — chart 3
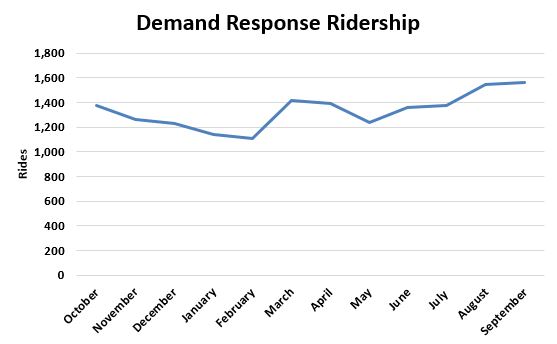
FY21 Year End Operations Information — chart 4
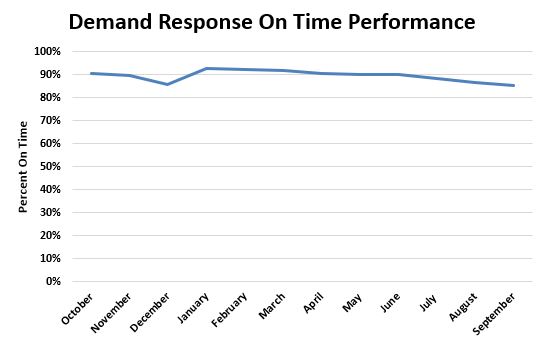
FY21 Year End Operations Information — chart 5
FY20 Year End Operations Information
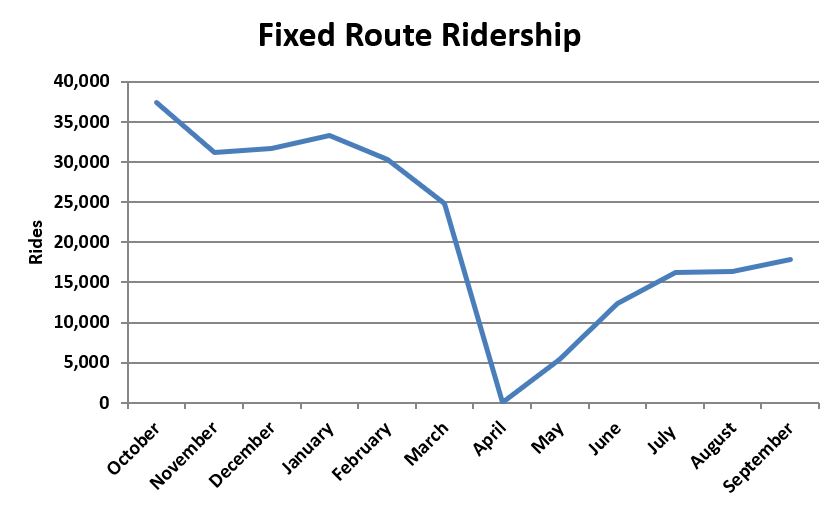
FY20 Year End Operations Information — chart 1
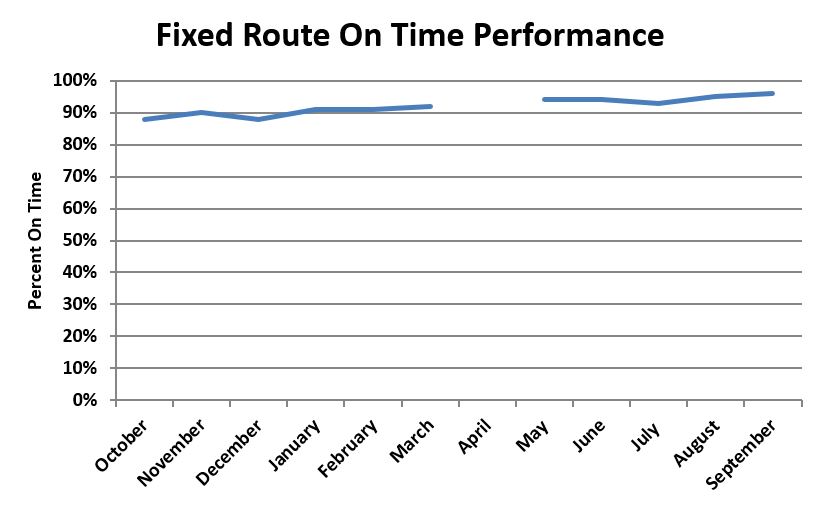
FY20 Year End Operations Information — chart 2
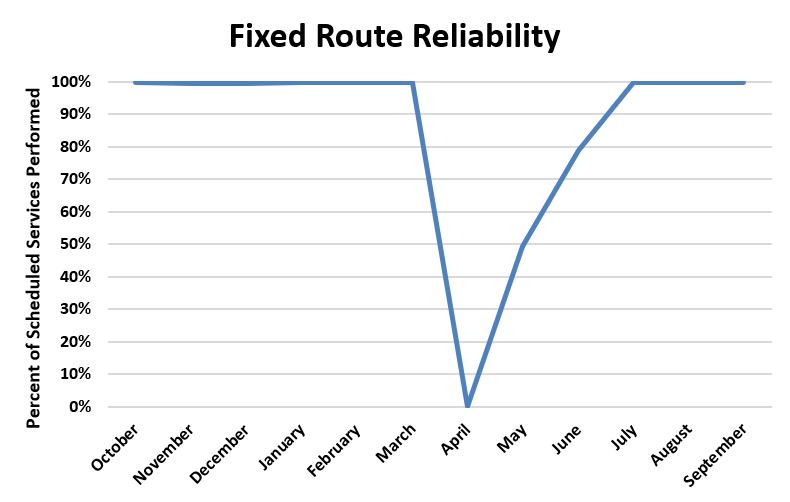
FY20 Year End Operations Information — chart 3
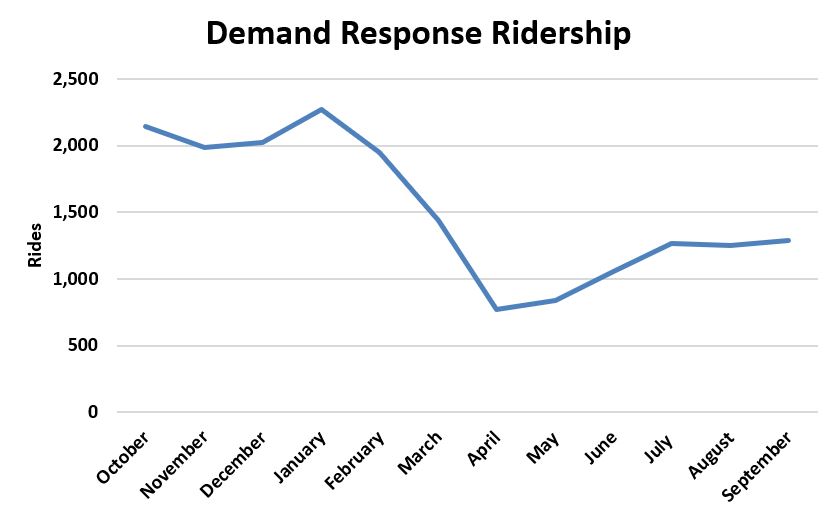
FY20 Year End Operations Information — chart 4
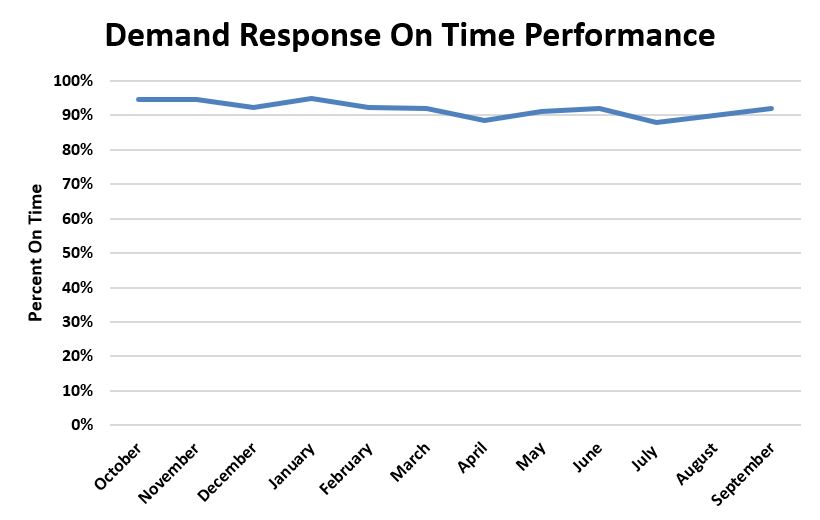
FY20 Year End Operations Information — chart 5
FY19 Year End Operations Information
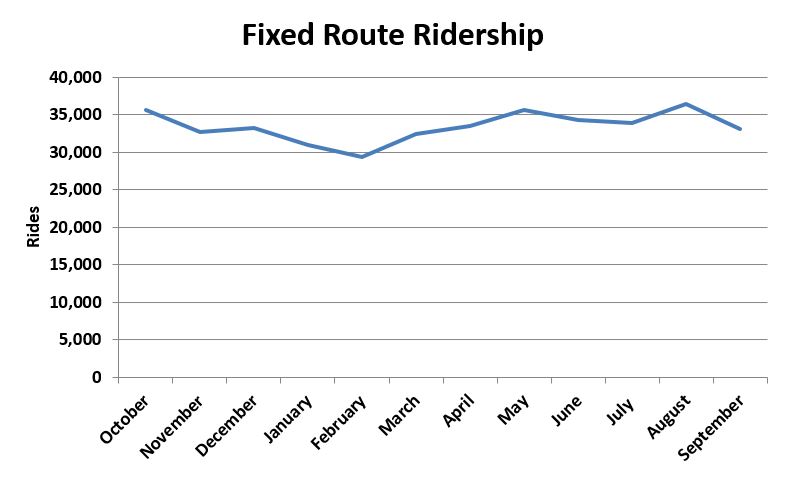
FY19 Year End Operations Information — chart 1
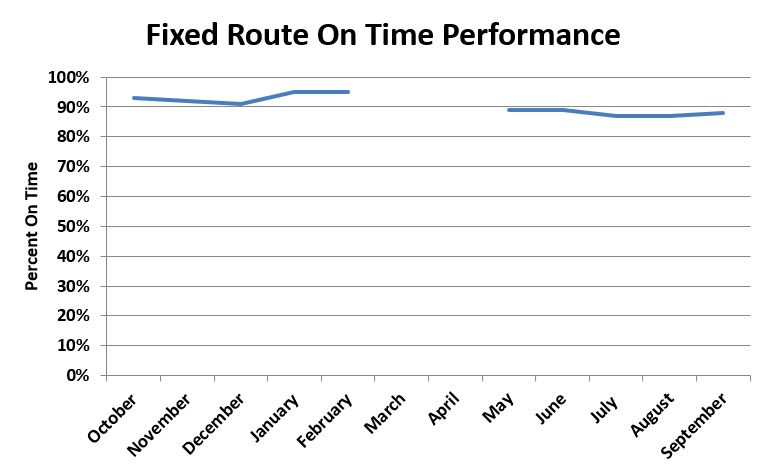
FY19 Year End Operations Information — chart 2
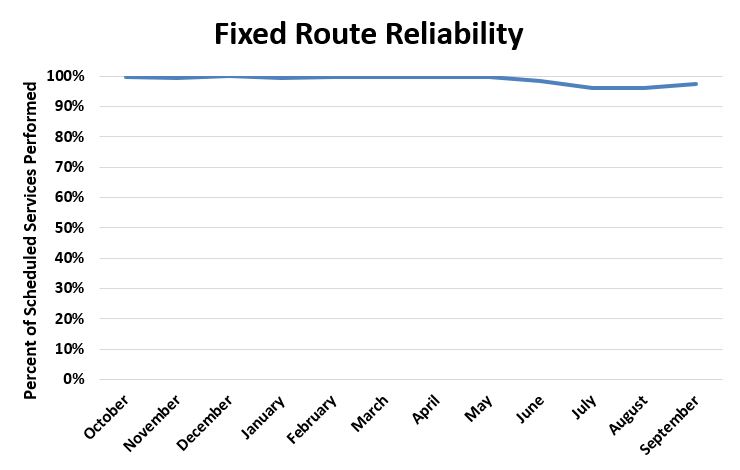
FY19 Year End Operations Information — chart 3
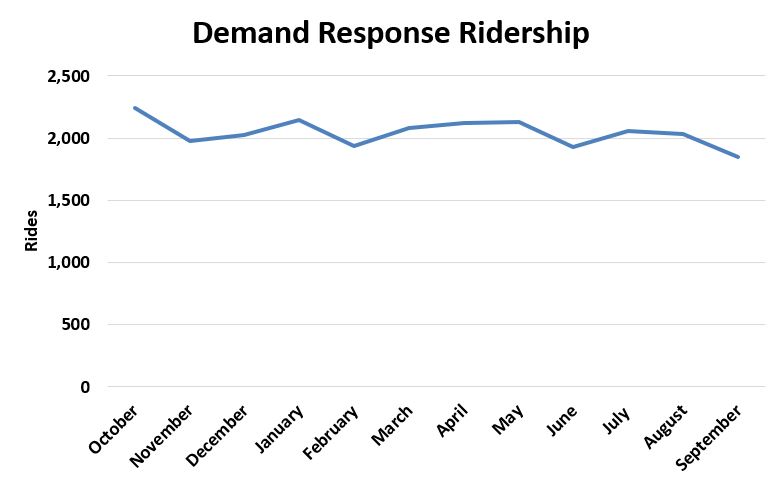
FY19 Year End Operations Information — chart 4
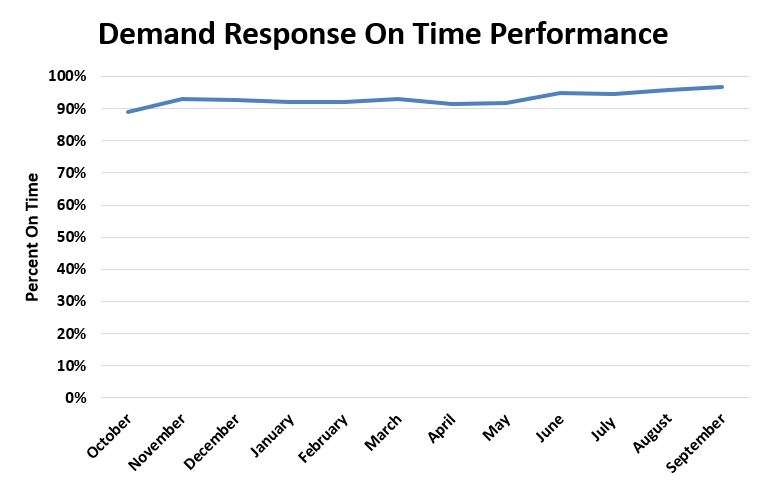
FY19 Year End Operations Information — chart 5
FY18 Year End Operations Information
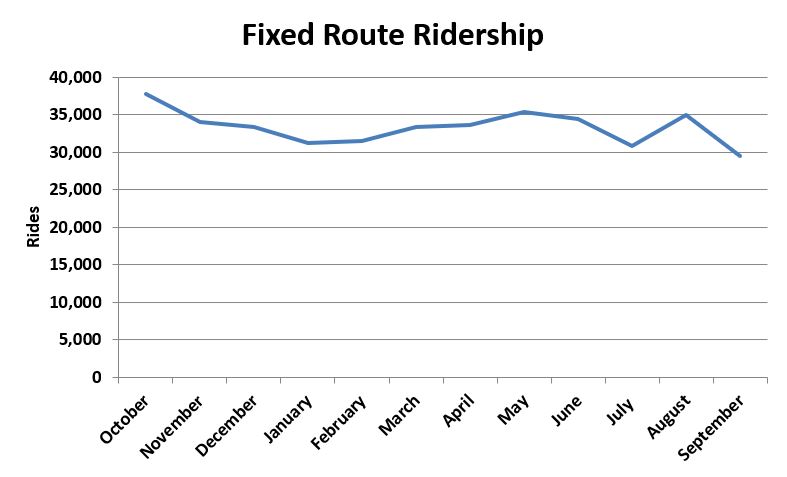
Fixed Route Ridership FY 18-3.JPG
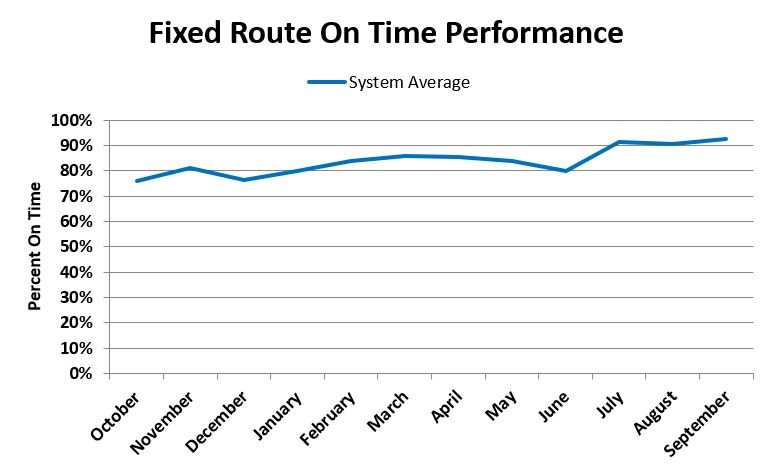
Fixed Route On Time Performance FY 18_3.JPG
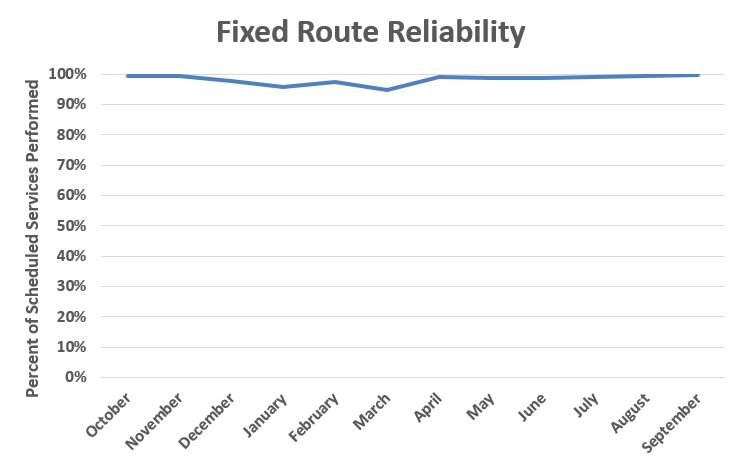
Fixed Route Reliability FY 18_3.JPG
Demand Response Ridership FY 18_3.JPG
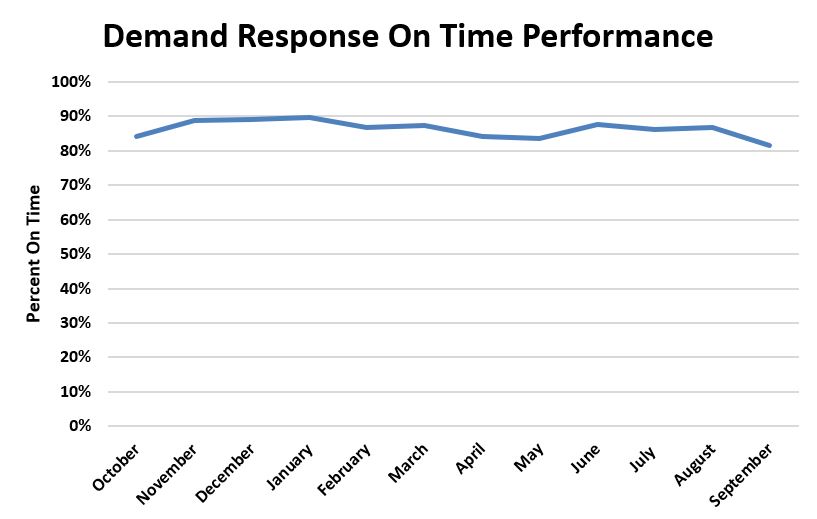
Demand Response On Time Performance FY 18_3.JPG